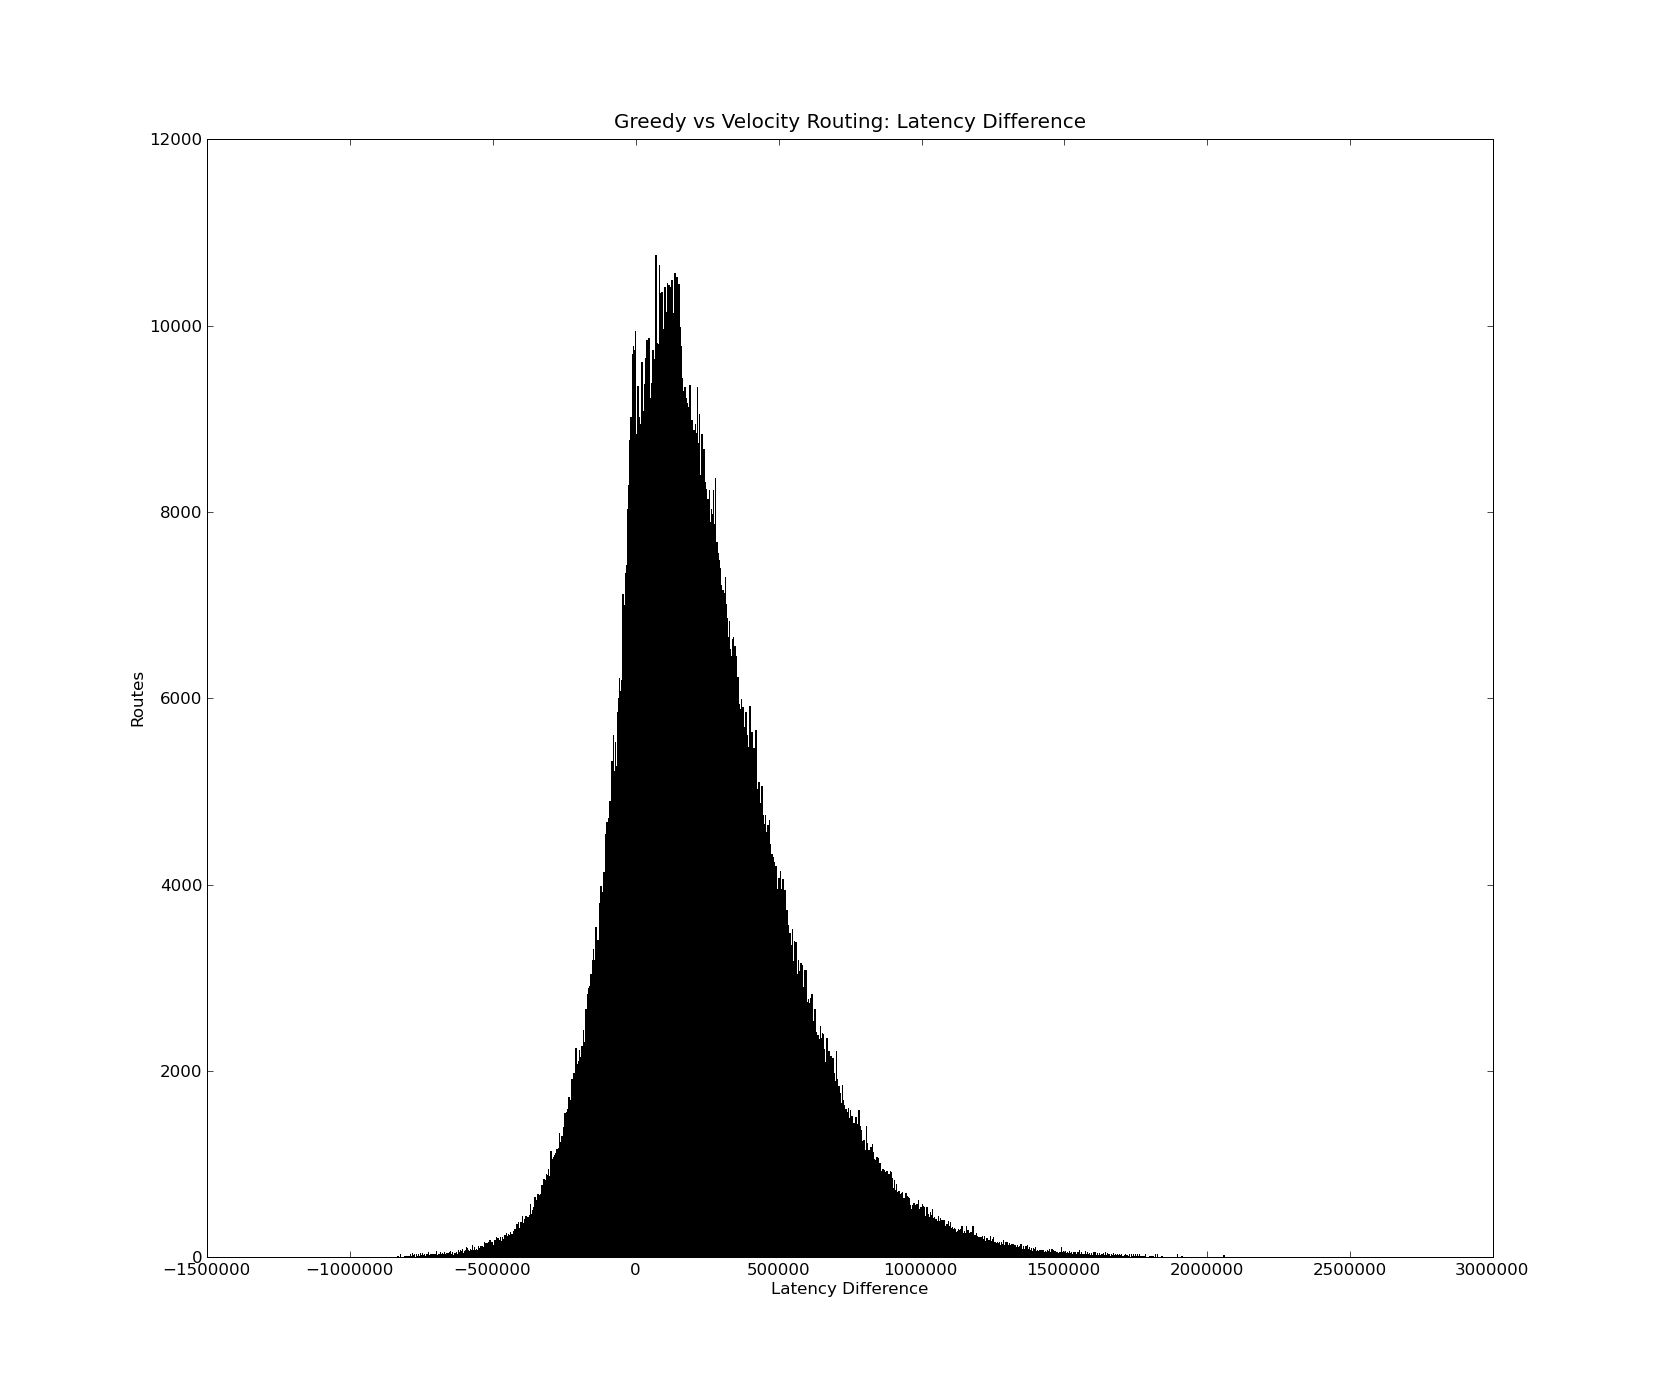
Same: 440337
Better: Count: 2057229 Mean: 319291.72213 Stdev: 257587.511895
Worse: Count: 530034 Mean: -122263.274852 Stdev: 115704.074039
Val1: Mean: 560729.370171 Stdev: 299076.214084
Val2: Mean: 365177.613796 Stdev: 169037.922021
So overall it looks pretty promising, better beats worse 4:1 with an average decrease of 320 ms vs average increase of 122 ms. Val1 is the greedy routing while Val2 is velocity routing.
Now for the pretty histogram of the differences! I suppose the next step may be to isolate the cases where large loss is found and see if we can come up with a solution to avoid that while not taking too much away from the really positive gains. The worst loss is half the best gain!

No comments:
Post a Comment